Skip to the content
  • Search
    • Deutsch
    • Leichte Sprache
    • Čeština
  • Font/Contrast
    • Change contrast
    • Enlarge font
  • Exhibition
    • The Exhibits
    • Mobile Adventure Land
    • MathsLive
  • Visit
    • Visitor information
    • Contact
  • Adventureland Online
    • Advanced Texts
    • Workshops2Go
    • #enjoyinglearning
  • Schools visiting
    • Schools visiting
    • Workshops
    • Tips for the visit
  • Leisure
    • Leisure
    • The Epsilon
    • Actionsbounds
    • Mathematics in Conversation
    • Handicraft sheets
    • Borderless Adventure Land
  • About Us
    • About Us
    • Support Association
    • Sponsors and Supporters
    • Jobs
    • Contact
  • Search
  • Font/Contrast
    • Kontrast ändern
    • Schrift vergrößern
    • Deutsch
    • Leichte Sprache
    • Čeština

I am a function

The experimenter can move back and forth on a 4-metre track. Its position is detected by a photocell. The graph of a given function appears on a screen in a coordinate system. The experimenter is now required to “trace” this curve in the form of a path-time diagram through his movements. The attempt to do this takes 10 seconds.

The experiment will now be explained using two examples:

If the given path-time diagram (e.g. for 6 seconds) has the following form

this means: You start directly in front of the screen and then move in the following way:

  • In phase 1, you move away from the screen at a constant speed.
  • In phase 2, you move away from the screen with increasing speed.
  • In phase 3 you stand still; the distance to the screen remains constant.
  • In phase 4 you move away from the screen (again) at a constant speed.
  • In phase 5 you move away from the screen with decreasing speed.
  • In phase 6 you stop.

If the path-time diagram given as a running rule has the following form

then this means:

  • Start (at time t=0) at a distance of three metres from the screen.
  • For 0\lt t\lt 1 (i.e. within the first second), approach the screen to a distance of 2.91m.
  • For 1\lt t\lt 7 (i.e. within the next 6 seconds) move first (t\lt 4) with increasing then (t\gt 4) with decreasing speed towards a distance of 3.82m from the screen.
  • For t\gt 7 one runs with increasing speed again up to 2,91m towards the screen.

Here, the time is given in seconds.

And now … the mathematics:

In mathematics, a function f \colon A \to B (or mapping) is a relation between two sets A and B that assigns to each element x (also independent variable or x-value) of A (domain of definition) exactly one element y (also dependent variable or y-value) of B (domain of values).

The concept of a function or figure occupies a central position in modern mathematics. In a so-called path-time diagram, the considered function f\colon t \mapsto f(t) \coloneqq y=f(t) is a function of time t (t\gt 0) with real values.

In the experiment “I am a function“, these values of the function f are between 0 and 4, indicating the possible distance (in metres) of the visitor from the screen. The definition range is A=\{t\,|\,t\gt 0\} and the value range B=\{s\,|\,0\lt s\lt 4\}.

However, the concept of function plays a very important role not only in mathematics, but also in everyday life. In this way, numerous processes, such as movements, temperature and pressure curves and economic processes can be described by functions.

There are different formulations to describe functions, as the following example shows:

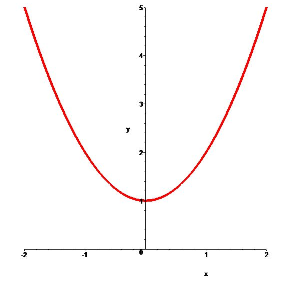
  • Function term: f(x)=x^2+1.
  • Function equation: y=x^2+1.
  • Assignment rule: x\mapsto x^2+1.

In each case, each real number x is assigned its square x^2 increased by the value 1, i.e. x^2+1. The graphical representation in a rectangular (Cartesian) coordinate system then has the following form:

For finite, but also countably infinite definition ranges, it is also possible to specify a function by a table of values, such as for y=f(x)=x^2+1 for discrete (countably infinite) values x=1,2,3,\ldots.

x1234567\ldots
y=x^2+1251017263750\ldots

Table 1: Table of values of the function y=x^2+1

Literature

[1] Beutelspacher, A.: Mathematik zum Anfassen, Gießen, 2005.

[2] Lehmann, I., und Schulz, W.: Mengen — Relationen — Funktionen: Eine anschauliche Einführung, 3. Auflage, Wiesbaden, 2007.

[3] Nollau, V.: Mathematik für Wirtschaftswissenschaftler, 4. Auflage, Wiesbaden, 2003.

[4] Warlich, L.: Grundlagen der Mathematik für Studium und Lehramt: Mengen, Funktionen …, Wiesbaden, 1996.

Opening Hours and Ticket Prices

Tuesday – Friday: 9 am – 5 pm
Saturday, Sunday and holidays: 10 am – 6 pm

Entry: 5 Euro / discount. 4 Euro

Special prices apply for groups and families, for guided tours or for photo and video permission.

  • Legal Notes
  • Data protection
  • Accessibility
© 2022

Adress

Erlebnisland Mathematik
Technische Sammlungen Dresden
Junghansstraße 1-3
01277 Dresden

Visitor Service

0351 – 488 7272 | service@museen-dresden.de