Skip to the content
  • Search
    • Deutsch
    • Leichte Sprache
    • Čeština
  • Font/Contrast
    • Change contrast
    • Enlarge font
  • Exhibition
    • The Exhibits
    • Mobile Adventure Land
    • MathsLive
  • Visit
    • Visitor information
    • Contact
  • Adventureland Online
    • Advanced Texts
    • Workshops2Go
    • #enjoyinglearning
  • Schools visiting
    • Schools visiting
    • Workshops
    • Tips for the visit
  • Leisure
    • Leisure
    • The Epsilon
    • Actionsbounds
    • Mathematics in Conversation
    • Handicraft sheets
    • Borderless Adventure Land
  • About Us
    • About Us
    • Support Association
    • Sponsors and Supporters
    • Jobs
    • Contact
  • Search
  • Font/Contrast
    • Kontrast ändern
    • Schrift vergrößern
    • Deutsch
    • Leichte Sprache
    • Čeština

Oscillating Spheres

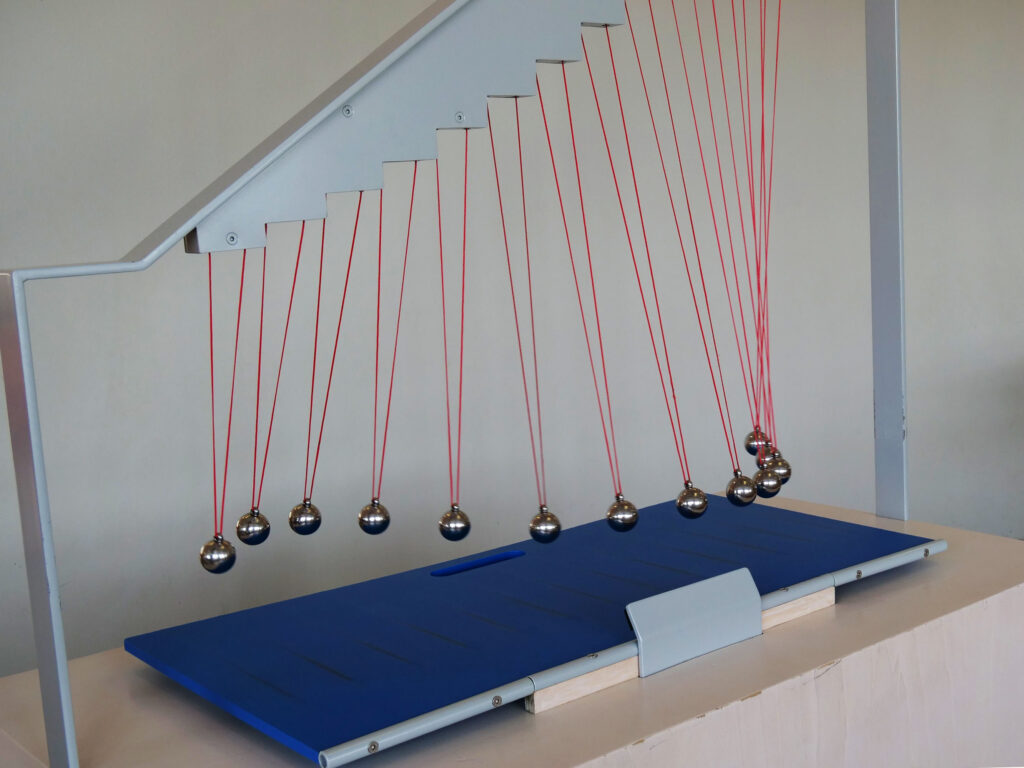
Oscillations are a mathematically very interesting topic. In the Maths Adventure Land, the behaviour of swinging mathematical pendulums can be experienced with the ” Oscillating Spheres” exhibit. As the following figure 1 shows, 13 metal spheres hang from thread pendulums of varying lengths that are attached to a curvilinear suspension.

Figure 1: Oscillating metal spheres on thread pendulums

In this experiment, by lowering the blue rail (see figure 1), you simultaneously trigger the oscillation of all 13 spheres. They leave their respective maximum deflections at the same time. Thus, for the observer, they initially swing back and forth seemingly without any rules.

If you observe the oscillations of the spheres over a longer period of time, you discover the following behaviour:

At the start, the oscillations of all pendulums begin simultaneously and then change into a discrete sinusoidal form, the amplitudes of which continuously increase. When the greatest number of amplitudes of this “swinging phenomenon” is reached, the direction of swing of each pendulum is opposite to the direction of swing of its neighbours (the first and last pendulums, of course, have only one neighbour). So every second pendulum swings in the same direction. The visual impression is that the pendulums are temporarily swinging in two “fronts” towards each other and then “interlock” again. Finally, a discrete sine oscillation of the spheres can be observed again, the amplitude of which decreases until they jointly reach (approximately) their initial position again (after 40 seconds in the experiment in the Maths Adventure Land). Of course, the process described in this way subsides over time as friction slows down the pendulum movements (i.e. the maximum deflections of the individual pendulums gradually become smaller until they come to a complete stop).

And now … the mathematics:

Let A(n) denote the number of oscillations of the n-th pendulum (n=1,\ldots,13) in the period T=40\mathrm s. Then, given an oscillation period of two seconds for the longest pendulum and assuming that the number of oscillations of neighbouring pendulums in the time interval T differ by exactly one, A(n+1)=A(n)+1, i.e. A(n)=n+19 for n=1,\ldots,13.

Thus, if the n-th pendulum has the period of oscillation T(n), then T(n)=\frac {40} {19+n}\mathrm s. Because of the relationship between the period of oscillation T(n) and length l(n) of the mathematical (thread) pendulum T(n)=2\pi\sqrt{l(n)/g} (where g denotes the acceleration due to gravity), we now obtain for the lengths l(n) of the individual pendulums:

    \[l(n)=\left(\frac{T(n)}{2\pi}\right)^2 g\quad(\ast).\]

The specific values for l(n), n=1,\ldots,13 for the exhibit in the Maths Adventure Land can be seen in Table 1 below:

nl(n) (in metres)
10,9940
20,9016
30,8215
40,7516
50,6903
60,6361
70,5881
80,5454
90,5071
100,4728
110,4418
120,4137
130,3883

Table 1: Length of the individual thread pendulums in metres

Thus, for the frequency f(n) and the angular frequency \omega(n) of the n-th pendulum, it follows from f(n)=1/T(n) and \omega(n)=2\pi f(n)=2\pi/T(n) that f(n)=\sqrt{g/l(n)}/(2\pi) and \omega(n)=\sqrt{g/l(n)}. The individual values for f(n) and \omega(n) can be read in Table 2 below (given in Hertz):

nfrequency f(n)angular frequency \omega(n)
10,53,1416
20,5253,2987
30,553,4558
40,5753,6128
50,63,7700
60,6253,9270
70,654,0841
80,6754,2412
90,74,3982
100,7254,5553
110,754,7124
120,7754,8695
130,85,0265

Table 2: Frequency and angular frequency of the n-th pendulum

The moment angles \alpha_n(t) at time t of the thirteen mathematical pendulums (n=1,\ldots, 13) have the following equations of motion

    \[\alpha_n(t)=\alpha_{\max}(n)\sin(\omega(n)t+\pi/2)=\alpha_{\max}(n)\sin\left(\frac{\pi(19+n)t}{20\mathrm s}+\frac{\pi} {2} \right).\]

The sinusoidal term shows the reason for the apparent appearance of a discretised sinusoid along the pendulum. Here \alpha_{\max}(n)=\arcsin(L/l(n)) with L=0.33\mathrm m as the horizontal distance of the balls in the delivery at the start and the respective vertical under their suspension. For these values \alpha_{\max}(n) (n=1,\ldots,13) one obtains for the considered experiment in radians (and in radians) the values of the following table 3:

n\alpha_{\max}(n) (radian measure)\alpha_{\max} (radians)
10,338419,39^\circ
20,374721,47^\circ
30,413423,69^\circ
40,454826,04^\circ
50,498528,56^\circ
60,545431,25^\circ
70,595734,13^\circ
80,649937,23^\circ
90,708540,60^\circ
100,772744,27^\circ
110,843648,33^\circ
120,923452,91^\circ
131,015958,20^\circ

Table 3: Deflections of the individual pendulums

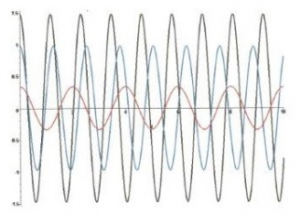
For the selected pendulums n=1,6,11, the instantaneous deflection angle (at time t) shown in figure 2 is then obtained in radians in a graphical representation for t=0\mathrm s to t=10\mathrm s:

Figure 2

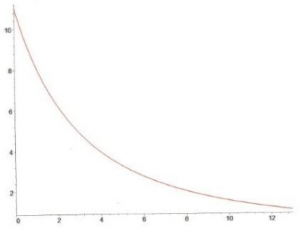
From the equation (\ast) it follows that the upper limiting line of the suspensions satisfies an equation of the form

    \[y=f(x) =g\left(\frac{20\mathrm s}{\pi(19+13-x)}\right)^2\]

with 0\leq x\leq 13, where one unit length of x corresponds to the distance of each two adjacent spheres at rest. In the following graphical representation, the value 1 was chosen for this unit of length:

Figure 3: Suspension curve of the balls

Comment:

The idea for the exhibit comes from a study published in February 1991 by the American physicist Richard E. Berg (University of Maryland), which appeared in the American Journal of Physics and dealt with swinging mathematical pendulums. The impetus for this was a video recorded by C. Alley (also University of Maryland) at Moscow State University, where he was on a study visit in 1987.

Literature

[1] Berg, Richard E.: Pendulum waves: A demonstration of wave motion using pendula. in: American Journal of Physics 59 (2), S. 186–187, 1991.

Opening Hours and Ticket Prices

Tuesday – Friday: 9 am – 5 pm
Saturday, Sunday and holidays: 10 am – 6 pm

Entry: 5 Euro / discount. 4 Euro

Special prices apply for groups and families, for guided tours or for photo and video permission.

  • Legal Notes
  • Data protection
  • Accessibility
© 2022

Adress

Erlebnisland Mathematik
Technische Sammlungen Dresden
Junghansstraße 1-3
01277 Dresden

Visitor Service

0351 – 488 7272 | service@museen-dresden.de