Skip to the content
  • Search
    • Deutsch
    • Leichte Sprache
    • Čeština
  • Font/Contrast
    • Change contrast
    • Enlarge font
  • Exhibition
    • The Exhibits
    • Mobile Adventure Land
    • MathsLive
  • Visit
    • Visitor information
    • Contact
  • Adventureland Online
    • Advanced Texts
    • Workshops2Go
    • #enjoyinglearning
  • Schools visiting
    • Schools visiting
    • Workshops
    • Tips for the visit
  • Leisure
    • Leisure
    • The Epsilon
    • Actionsbounds
    • Mathematics in Conversation
    • Handicraft sheets
    • Borderless Adventure Land
  • About Us
    • About Us
    • Support Association
    • Sponsors and Supporters
    • Jobs
    • Contact
  • Search
  • Font/Contrast
    • Kontrast ändern
    • Schrift vergrößern
    • Deutsch
    • Leichte Sprache
    • Čeština

Shortest distance on the globe

In January 2011, Lufthansa reported that one of its Boeing 747 aircraft had aborted its flight to San Francisco over Greenland due to oil loss in one of the four engines and had returned to Frankfurt am Main.

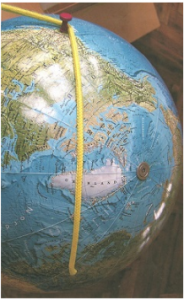
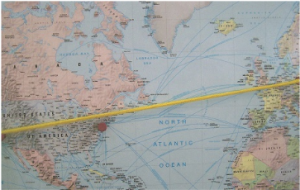
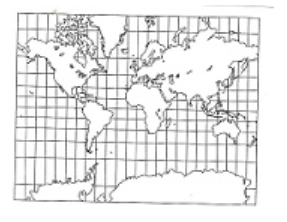
Looking at a map of the world, one wonders in amazement what the Boeing 747 is “doing” on a direct flight Frankfurt am Main — San Francisco over Greenland. If, on the other hand, you look at a globe, it immediately becomes clear that the shortest route from Frankfurt am Main to San Francisco is precisely across Greenland (cf. Figure 1) and not — as a world map (cf. Figure 2) suggests — “passing” New York at a distance of about 100 miles north.

An experiment in ADVENTURE LAND MATHEMATICS makes this clear by comparing distances on the globe and a world map, as the following illustrations show:

Figure 1: Route from Frankfurt am Main to San Francisco on the globe
Figure 2: Route from Frankfurt am Main to San Francisco on the map

Of course, the shortest connection between two points in a plane is a straight line. Their length is the so-called Euclidean distance (Figure 2 shows this clearly).

BUT:

The role of straight lines in spherical geometry (i.e. geometry on the sphere) is played by the so-called great circles. Great circles are circles on the sphere whose (so-called “Euclidean“) centre is the centre of the sphere. Examples of great circles on the globe are the equator and the meridians. A great circle is obtained by intersecting the surface of the sphere with a plane containing the centre of the sphere.

This means that the shortest connection between two points on a sphere (i.e. in particular between two cities on the globe) is part of a great circle. In the specific case of the shortest connection from Frankfurt am Main to San Francisco, the corresponding great circle — i.e. the shortest connection between these two cities — runs right through the middle of Greenland.

A (plane) world map does not reflect this state of affairs, since the mapping of a sphere onto a plane necessarily requires that at least one of the following properties be dispensed with in this mapping: namely, angular fidelity or surface fidelity or distance fidelity or direction fidelity.

And now … the mathematics:

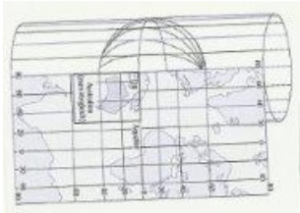
In ADVENTURE LAND MATHEMATICS, a world map is shown next to a globe, which was created by a — in principle — cylindrical projection. Here, a (simple) cylindrical projection is understood to be an image in which the surface of a sphere is projected onto a cylinder. Specifically, in a so-called tangential cylinder projection, the sphere touches the cylinder at one of its great circles (e.g. at the equator). One can imagine this projection as follows: The light rays emanating from a light source in the centre of the sphere (assumed to be translucent) then map the surface of the sphere onto the inside of the cylinder (cf. Figure 3). It is therefore a central projection.

Figure 3: Cylindrical projection

This projection — it is true to the angle — is often (but probably wrongly!) called the Mercator projection. Although the actual Mercator projection is a cylindrical projection, there is a significant difference to the projection method shown in Figure 3. In the actual Mercator projection, the image created by (central) projection is distorted in the direction of the cylinder axis so that the scale in the vertical north-south direction is the same at every point as in the horizontal east-west direction. Consequently, the scale changes constantly from the equator towards the North Pole on the one hand and towards the South Pole on the other, but it is the same at every place on the globe in the vertical and horizontal direction.

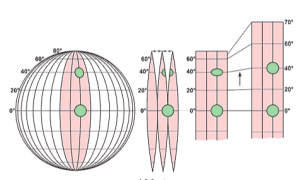
The Mercator projection is therefore not a projection that can be described optically (e.g. by the course of light rays), but can only be generated analytically, i.e. by mathematical mapping properties. In order to be able to imagine the process of this projection, one uses the following plausibility consideration: one imagines the earth as a spherical balloon and brings this into a glass cylinder so that the equator (on the balloon) exactly touches the wall of the enveloping cylinder. If the balloon is inflated, the areas south and north of the equator are increasingly pressed against the cylinder wall in the respective polar direction. The scale thus changes constantly and in both directions. The construction of a Mercator map is shown in Figure 4 below:

Figure 4: Construction of the Mercator map

For clarification, two circles are drawn on a sphere. The first circle at 0°, i.e. at the equator, the second circle at 60°. If we now unwind the surface of the sphere, curvilinear two-corners are formed which touch at the equator and move away from each other continuously in both polar directions. If you now stretch the surfaces so that there are no more gaps, you can see that the upper circle has been distorted. The stretching in x direction made it an ellipse. In the third part of the Mercator construction, the map is now stretched so that all circles become circles again. This means that the distances between the latitudes increase towards both the North Pole and the South Pole. This distortion also means that Mercator maps generally only extend to 60° or 70° latitude in a northerly or southerly direction. The presentation of the poles must therefore be omitted.

The Mercator design is true to the angle. Therefore, so-called loxodromes (i.e. curves that always intersect the meridians at the same angle) become curves that are piecemeal straight lines. But: Mercator’s design is not true to the area, as Figure 2 shows — even if only partially: Although the island of Greenland has only about 1/15 of the area of the African continent, it appears about as large as Africa on a world map:

Figure 5: World map in Mercator projection

Literature

[1] Kuntz, E.: Kartennetzentwurfslehre: Grundlage und Anwendungen, 2. Auflage, Karlsruhe, 1990.

[2] Schröder, E.: Kartenentwürfe der Erde, Frankfurt am Main, 1988.

Opening Hours and Ticket Prices

Tuesday – Friday: 9 am – 5 pm
Saturday, Sunday and holidays: 10 am – 6 pm

Entry: 5 Euro / discount. 4 Euro

Special prices apply for groups and families, for guided tours or for photo and video permission.

  • Legal Notes
  • Data protection
  • Accessibility
© 2022

Adress

Erlebnisland Mathematik
Technische Sammlungen Dresden
Junghansstraße 1-3
01277 Dresden

Visitor Service

0351 – 488 7272 | service@museen-dresden.de